Main business
Metal
Metal
| Small category |
Service |
| Metallic materials |
- Qualitative and quantitative analysis of steel and iron alloy steel
- Qualitative and quantitative analysis of nonferrous metal such as copper, aluminum, magnesium, lead, nickel, titanium alloys, etc.
- Determination of main components and impurities of ferroalloys
|
| Precious metal |
- Purity analysis of high purity gold, silver and platinum
- Analysis of ingredients of dental materials
- Purity analysis of accessories(14k, 18k, 24k)
- Gold content analysis using Cupellation
- Analysis of gold and palladium contents in industrial ion exchange resins
|
Minerals
Minerals
| Small category |
Service |
| Silicate minerals |
Chemical analysis(wet and dry analysis) of silica, silica, feldspar, kaolin, clay, etc. |
| Refractories |
Chemical analysis of refractory bricks, refractory mortars, zirconia minerals, alumina minerals, etc. |
| Carbonate minerals |
Chemical analysis of limestone, dolomite, magnesite, slaked lime, quick lime, gypsum, cement, etc. |
| Building materials |
Analysis of filtration sand, filtration gravel, anthracite, classification of carcinoma, alkali potential reaction(chemical method) of aggregate, etc. |
Coal
Coal
| Small category |
Service |
| Coal, cokes, etc. |
- Calorimetric analysis
- Analysis(industrial analyzer) of moisture, volatile matter, ash, etc.
- Carbon / sulfur analysis
|
Medication
Medication
| Small category |
Service |
| Inorganic |
- Component analysis of acids, bases, water treatment agents, reagents, etc.
- Performance evaluation of snow remover
|
Hazardous substances
Hazardous substances
| Small category |
Service |
| RoHS / ELV |
- Analysis of 10 kinds of RoHS (Pb, Cd, Hg, Cr (Ⅵ), PBBs, PBDEs, DBP, BBP, DIBP, DEHP)
- Analysis of six kinds of ELV (Pb, Cd, Hg, Cr (VI), PBBs, PBDEs)
- Application of IEC 62321 international standard
- Hazardous substances analysis of RoHSⅡ (finished product test)
|
| Miscellaneous |
- Environmental product declaration test for paint and elastic packaging materials
- Analysis of phosphorus(P)-based flame retardants(TCEP, TDCPP, TDBPP) and brominated flame retardants(HBCD, TBBPA)
- Mercury analysis of fluorescent lamps
- Ni elution test of the products that contact skin directly or in long term
- Analysis of mineral and harmful elements of salt
|
Nano material
Nano material
| Small category |
Service |
| Field of analysis |
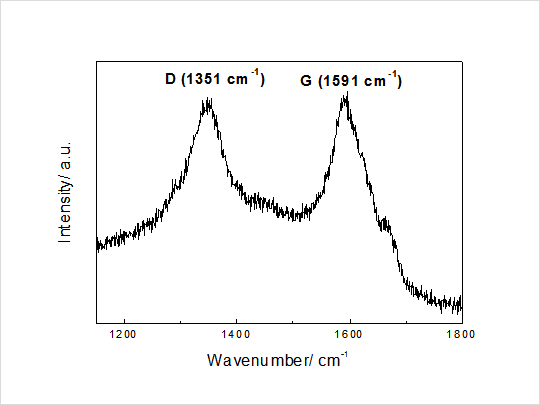
- Carbon nano materials - Analysis of chemical composition, characterization and structure
- Metal nanoparticles
- Electrochemical catalyst
|
Instrument analysis
Instrument analysis
| Small category |
Service |
| Analytical equipment |
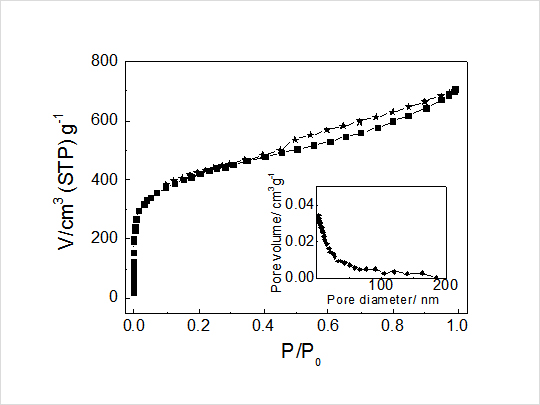
- Analysis of BET(Brunauer-Emmett-Teller) surface analysis equipment and BJH(Barrett-Joyner-Halenda)‘s pore size and volume
- Grain size analyzer(wet and dry)
- X-ray diffractometer
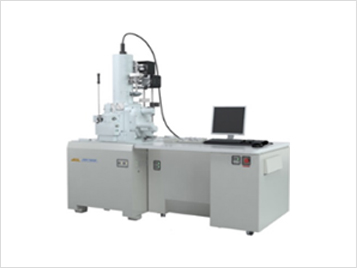
- Transmission electron microscope with high resolving power
- Forward scanning electron microscope
- X-ray photoelectron spectroscopy
|


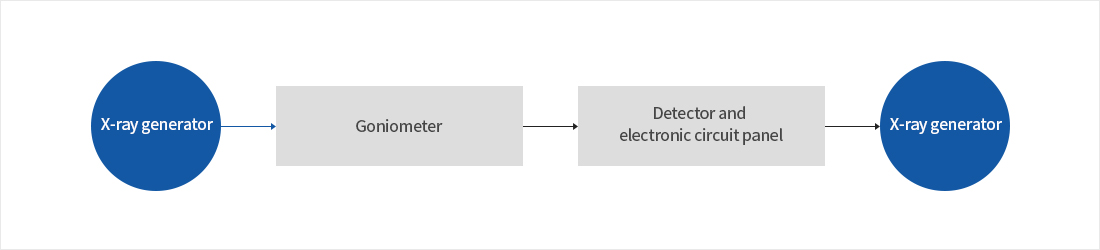
Measurement principle of ICP
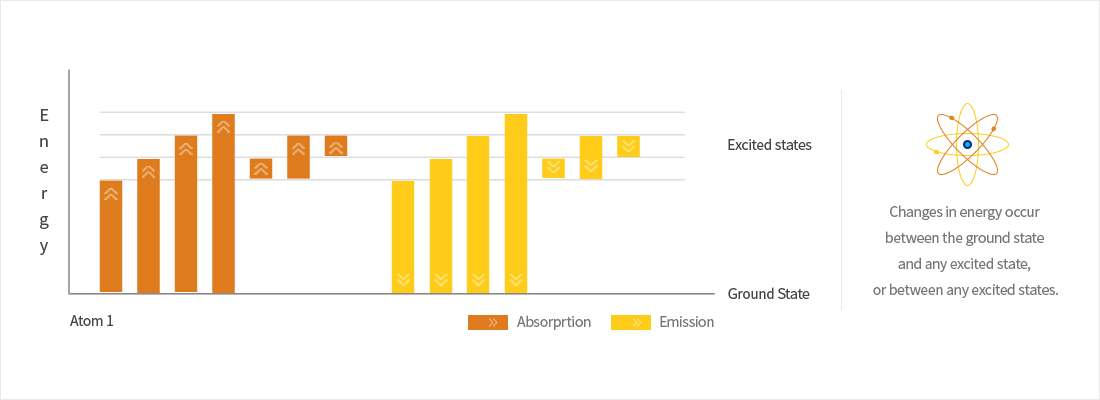

Diagram of ICP emission analyzer
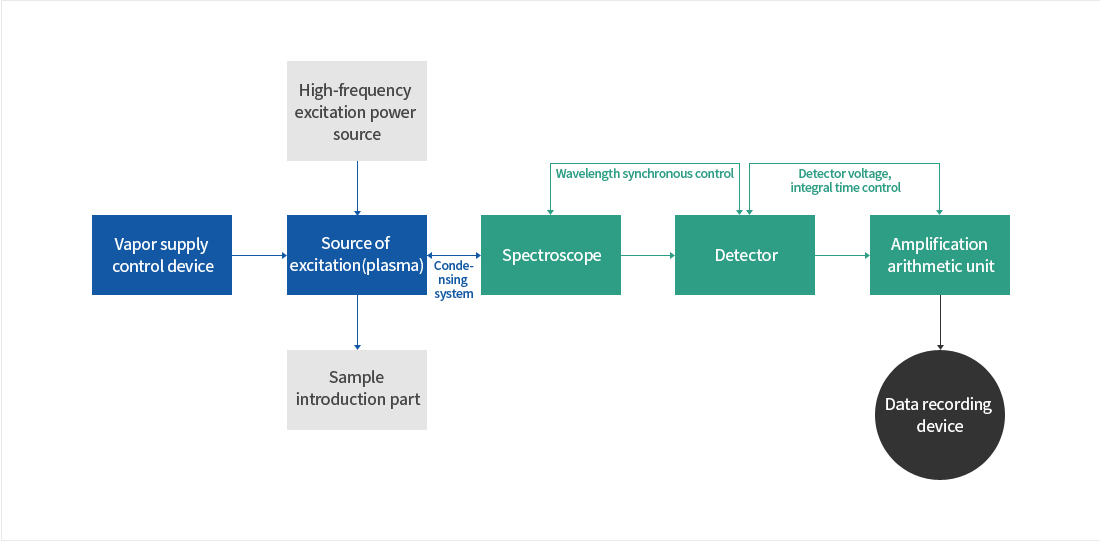
ICP type according to detector
PMT(Photo Multipier tube)
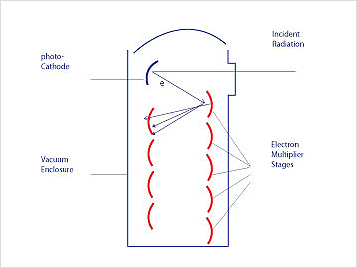
Place the photomultiplier tube just behind the exit slit of the spectrometer to detect the optical signal. After the photoelectric conversion, the intensity of the optical signal is measured. A standard photomultiplier tube is arranged with nine stages of dynodes, with a resistance between them, so that they have a slight difference in voltage.
The electrons generated from the negative pole of the photoelectricity by the collision of the photons are propagated one by one by the die node which can easily emit secondary electrons. Finally, they are collected on the two poles of the end.
CTD(Charge Transfer Detector)
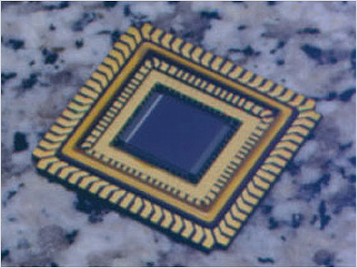
- - Detector with a solid state type. Area detection method that measures the radiation irradiated to a certain area.
- - Simultaneous analysis detector that detects all wavelengths simultaneously.
- - It can scan in 3 dimensions and has a ‘finger print’ function.
- - The voltage across the photomultiplier is 500-1000V, and photoelectrons are multiplied by 106 times.
- - Type
- · CID(Charge Injection Device) - XDL, XUV
- · CCD(Charge Coupled Device)
- · SCD(Segment Coupled Device)
ICP classification according to detection method
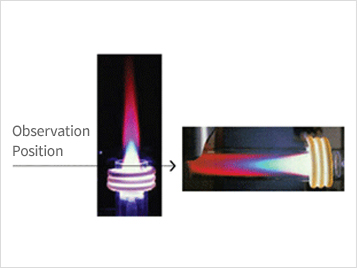
In general, ICP is divided into three types according to the detection method.
There is radial viewing, a classic approach. Then there is axial viewing which is currently used. We also have dual viewing that optimizes the advantages of these two methods.
ICP classification according to detection method
| |
Radial viewing |
Axial viewing |
| Advantage |
- - For alkali-metal analysis: Low ionization effect
- - Suitable for organic solvent samples and complex matrix samples
- - Uses Low power / Low flow plasma : Low Ar consumption
|
- - High sensitivity (2-10 times)
- - Low base value, improved accuracy and low detection limit
- - Suitable for samples with simple matrix
|
| disadvantage |
- - Low sensitivity
- - High base value
|
- - Ionization effect
- - High consumption of Ar
|
Overview
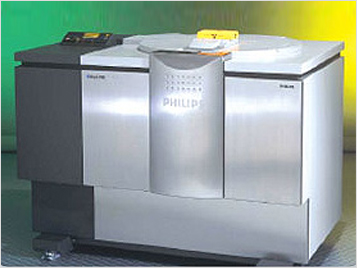
X-ray fluorescence spectrometer(XRF) and X-ray diffractometer(XRD) are available. Using X-ray fluorescence analyzer, we are conducting qualitative and quantitative analysis of minerals, metals and solutions. X-ray diffractormeter is used in qualitative/quantitative analysis and measuring lattice constants through analyzing the crystal structure of minerals, metals, single crystals and polymers.
X-ray fluorescence analysis
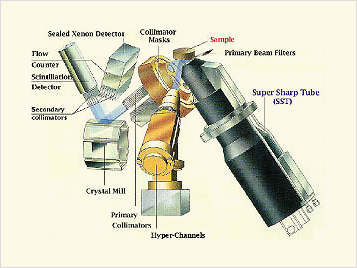
Principle
The X-ray fluorescence spectrometer consists of an X-ray tube, a specimen exposing device, an analyzing crystal plate and a detector. In X-ray tube, continuous X-rays are emitted from the minimum wavelength according to the applied voltage, to generate characteristic X-rays. These characteristic X-rays are spectroscopically measured by Bragg's diffraction method in the analytical crystal plate and detected by the detector. The wavelength is measured qualitatively in the sample, and the intensity of the characteristic X-ray and quantitative analysis is performed.
Scope of analysis
Nondestructive analysis can be performed without treating the sample using solution. The analysis of all elements from Boron to Uranium can be performed quickly and accurately from traces to tens of percent. X-ray fluorescence spectroscopy has a wide range of applications in terms of the type, physical condition, concentration range, and element of the sample.
- - Material analysis for iron and nonferrous
- - Analysis of various raw materials (mineral, soil, etc.)
- - Product analysis (Various additives and hazardous substances of ceramics, plastic and rubber products)
- - Analysis of various oil types (Ware metal in waste oil)
- - Analysis of water quality and environmental samples
Analysis example
- S analysis in oil
- Semi-quantitative analysis of unknown samples
X-ray diffractometer
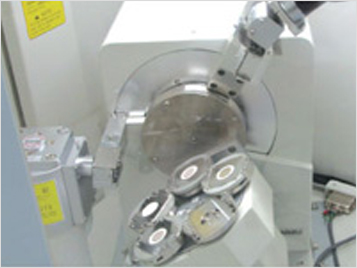
Principle
The metal crystal has a crystal lattice structure arranged three-dimensionally regularly. If the X-ray incident on the crystal satisfies the Bragg condition with respect to a certain lattice plane, it means it is an equipment using the phenomenon of causing Bragg reflection in a specific direction. Since its first observation by M. Laue et al. in 1912, it has been used as an important research tool for material structure, especially crystal structure analysis.
Scope of use
A structural measurement can be made on metals, alloys, inorganic compounds, rock minerals, organic compounds, polymers and biomaterials. It is also possible on crystalline and amorphous materials, powder and plate, liquid, ribbon and thin film specimens.
Features of X-ray diffraction analysis
- - Qualitative analysis of materials
- - Precise calculation of lattice constant
- - Determines the size of microlites
- - Investigates the good and bad aspects of the crystallinity
- - Investigates the orientation of crystals
- - Measures the deformation inside the crystal
- - Easily distinguishes between compounds and compounds
- - Confirmation of expansion and contraction of lattice caused by solidness
- - Quantitative analysis of each component by measuring the intensity of the diffraction line
- - Analysis of crystal structure
- - Easy to experiment
General structure of X-ray diffractometer
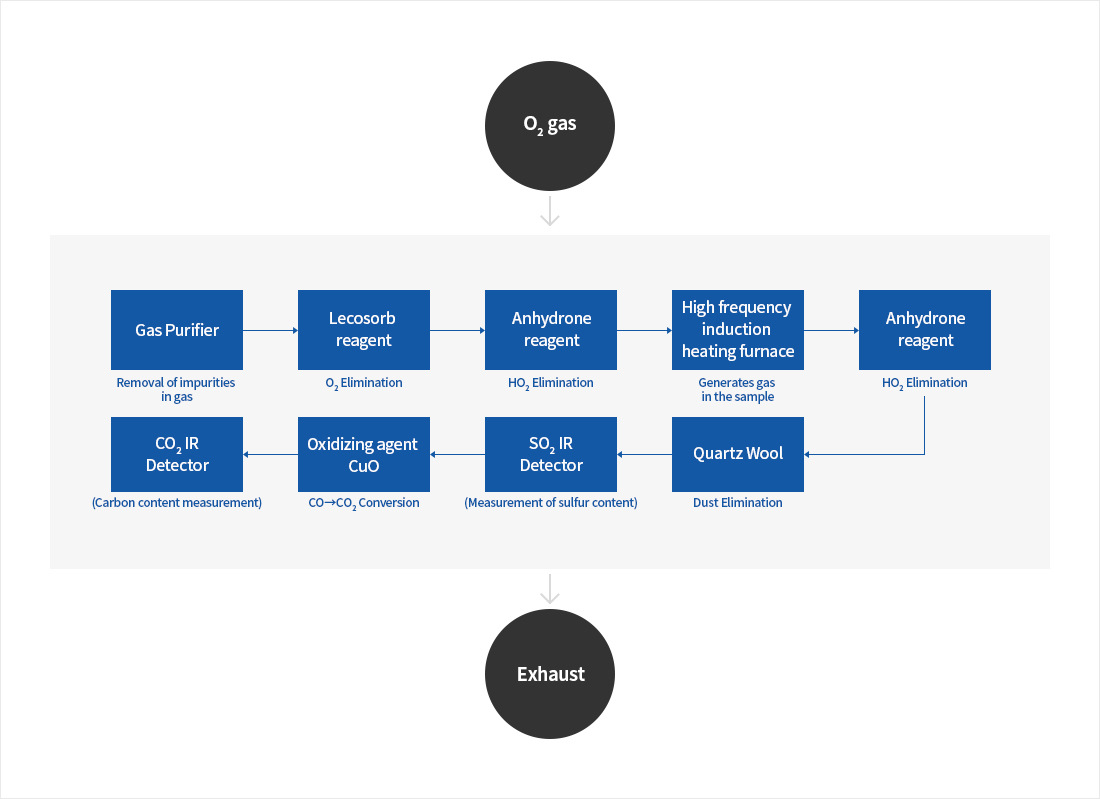
Carbon & Sulfur Analysis
Overview
All molecules except polar molecules such as oxygen, nitrogen, etc. are absorbed in the infrared region. Because all molecules have a unique spectral line, the C & S analyzer operates the furnace in an oxygen-filled Combustion Chamber and quantitatively detects the carbon and sulfur content of the energy-changing infrared cell.
Applied field
Determination of carbon and sulfur content in inorganic materials such as metals (steel and nonferrous), minerals, ceramics, etc.
※ Caution: Do not analyze volatile hydrocarbons because they affect IR cells.
Schematic diagram of equipment analysis
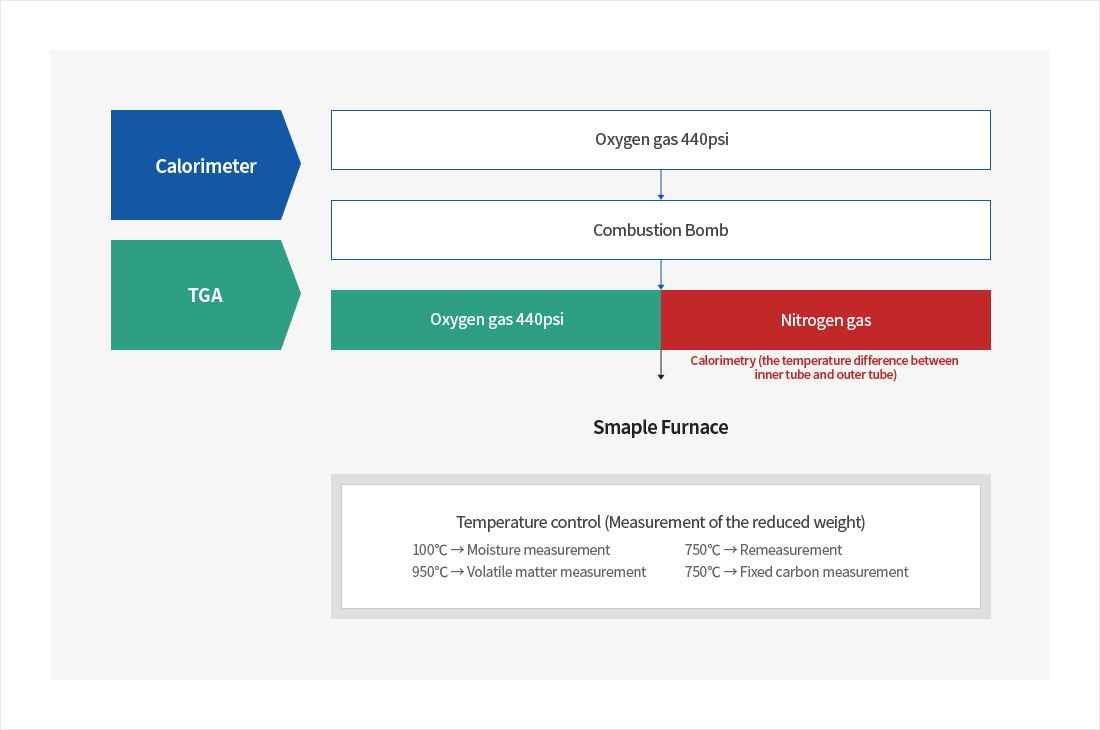
Industrial analysis
Overview
TGA (Thermo-gravimetric Analysis) It is a device to analyze the physical and chemical characteristics of a sample by measuring the change in the weight of the sample according to change of temperature. It can measure moisture, ash, volatile matter, fixed carbon, etc. by mass reduction caused by combustion.
Applied field
Measurement of moisture, ash, volatile matter, and fixed carbon contained in various organic samples(coal and waste samples)
Schematic diagram of equipment analysis
Nano material
- - Nano materials are used in a wide variety of applications, including carbon nano materials, metal nano particles, and electrochemical catalysts. Therefore, accurate analysis of each nano material is required.
- - We have equipment for analyzing various properties such as particle size, specific surface area, pore volume, nano structure, and morphology. We also provide latest information on nano analysis through collaboration with the most up-to-date equipments.
Nano analysis equipment
-
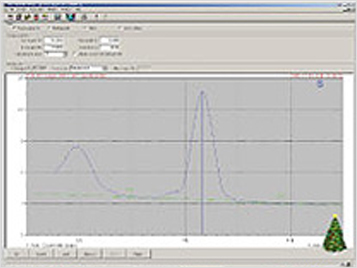
1. Particle size Analyzer
-

2. Nano Particle-size Analyzer
-
3. BET Surface Area Analyzer
-
4. Scanning Electron Microscopy (SEM)
-
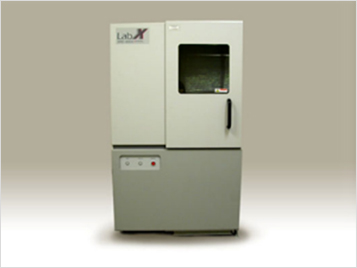
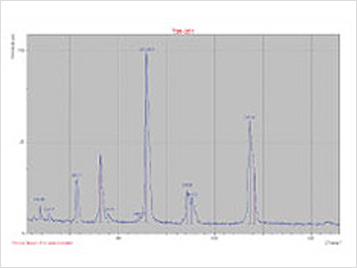
5. X-ray Diffraction (XRD)
- 1. Particle size Analyzer : Analyzes the size(diameter) and distribution of microparticles
- 2. Nano Particle-size Analyzer : Analyzes the size(diameter) and distribution of nano particles.
- 3. BET Surface Area Analyzer : Analysis related to pore surface of particles such as specific surface area, pore volume, average pore size through gas adsorption
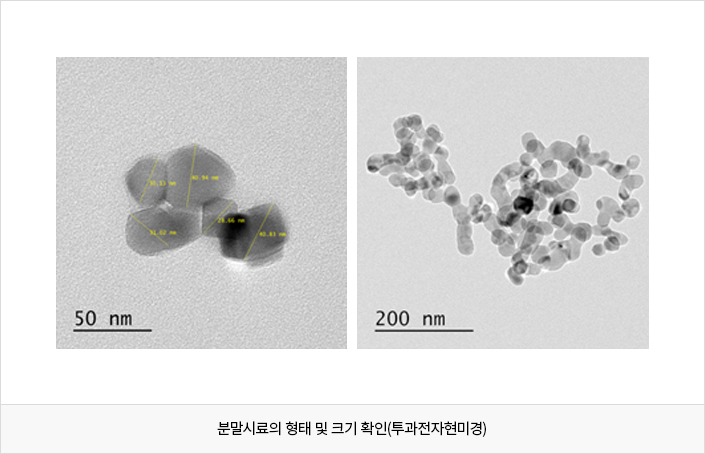
- 4. Scanning Electron Microscopy (SEM) : SEM can be used for microstructure analysis, particle size analysis and cross-section analysis through analyzing the sample surface. Also, qualitative analysis of unknown samples is possbile through EDS equipments.
- 5. X-ray Diffraction (XRD) : Analysis of nanostructures through crystallography in a wide range of materials including metals, minerals and catalysts
Case of analysis
Foreign substance analysis
‘Foreign substances’ mean 1g or more of figurine, stain, sculpture, plate which is generated through various routes.
Foreign substances generated during numerous manufacturing processes can interfere with the final product launch, and even after the release, the recall action can cause enormous damage. Organic/inorganic analysis for foreign substance is an objective and scientific database that can identify these degradation processes and is essential for the production of reliable products.
Unpredictable and unidentified foreign substances can have profound effects on the manufacturing process, so it is essential to understand and control foreign substances. For this reason, many companies are working hard to identify foreign substances, analyze foreign substances, and verify the effectiveness of removing foreign substances.
The proper analysis method depends on the nature of the foreign substances and the goal of the analysis. When analyzing foreign substances, consider the followin
- - Are the foreign substances expected to be inorganic(metal) or organic(polymeric)?
- - Are the amount of foreign substances expected to be large or small?
- - Are the foreign substances expected to be distributed widely or locally or in a granular form?
- - Do you expect the foreign substances to be located on the surface, specific layer, interface or substrate?
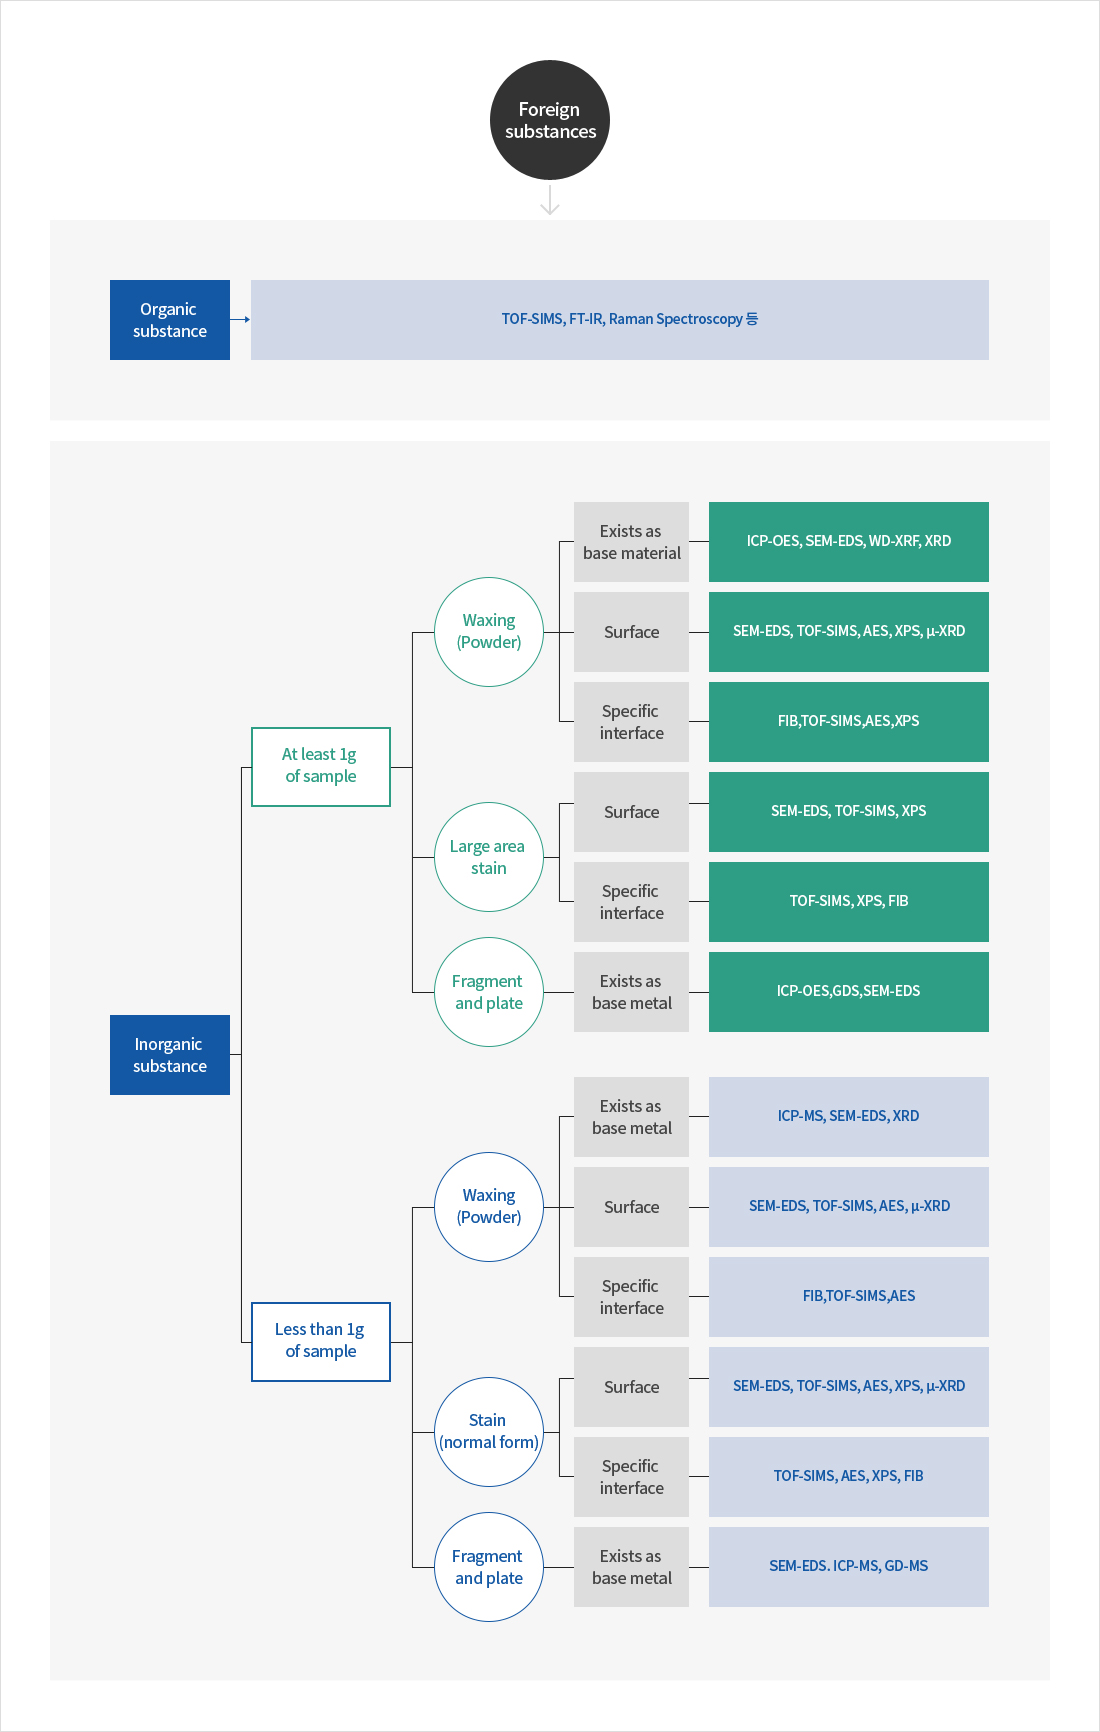
Selectable analytical techniques: The following analytical techniques are used depending on the type of foreign substances. If there is little or no information on the foreign substance, various analytical techniques can be used in multiple ways.
Particle shape
- - Scanning Electron Microscope(SEM)
- ?
- - Energy dispersive X-ray spectrometer(EDS, quantitative unit: at%, particle size: > 0.5 μm)
- ??
- - Fourier transform infrared spectrometer(FT-IR, particle size:> 15 μm, organic particles)
- ??
- - Auger Electron Spectrometer(AES, quantitative unit: at%, particle size: > 20 nm)
- ??
- - Time-of-flight Secondary Ion Mass Spectrometer (TOF-SIMS)
- ?
Remnant form
- - Auger Electron Spectrometer(AES, quantitative unit: at%, particle size: > 20 nm)
- - Fourier Transform Infrared Spectrometer(FT-IR, quantitative unit: at%, distribution type: small area)
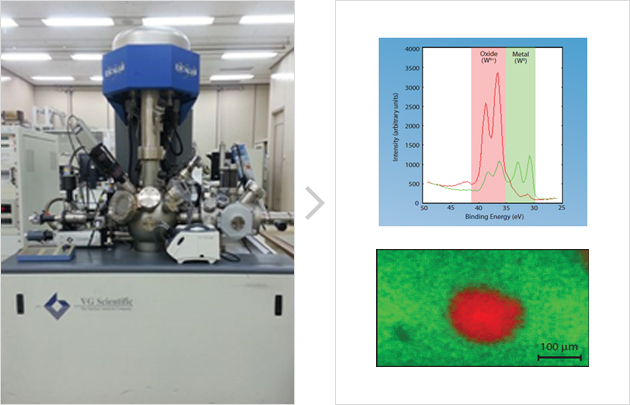
- - X-ray Photoelectron Spectrometer (XPS)
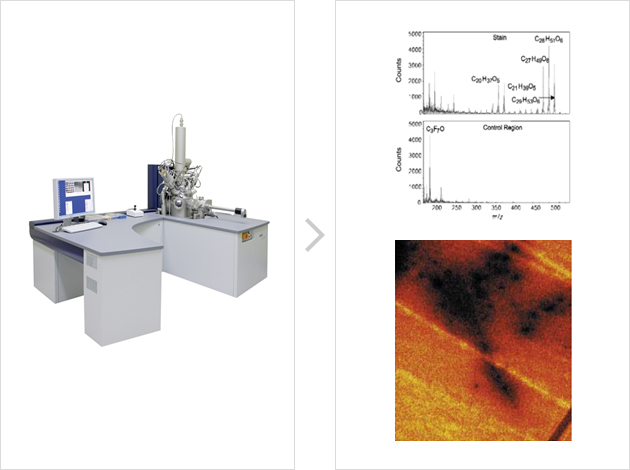
- - Time-of-flight Secondary Ion Mass Spectrometer (TOF-SIMS)
Discolored area and stain type
- -. X-ray Photoelectron Spectrometer (XPS, quantitative unit: at%. Able to determine the chemical bonding state)
- -. Auger Electron Spectrometer(AES, quantitative unit: at%, distribution type: small area)
- -. Time-of-flight Secondary Ion Mass Spectrometer(TOF-SIMS, unit: mg/kg (ppm). Able to analyze organic matters)
Shape of sedimentary facies
- -. Energy dispersive X-ray spectrometer(EDS, quantitative unit: at%, Depth of the sedimentary facies : > 0.5 μm)
- -. X-ray Photoelectron Spectrometer(XPS, elemental quantity)
- -. Auger Electronic Spectrometer (AES, quantitative Units : at %)
- -. Secondary Ion Mass Spectrometer(SIMS, quantitative unit : mg/kg (ppm), Depth of the sedimentary facies > 10 μm)
Mimetic diagram for foreign substance analysis
Case of foreign substance analysis - 1
Using X-ray photoelectron spectrometer, we have proved that the surface stain is tungsten oxide
Case of foreign substance analysis - 2
Using the Time-of-flight Secondary Ion Mass Spectrometer(TOF-SIMS), we have proved that the surface stain is machinery grease((C37H68O8)